Estimated reading time: 8 minutes
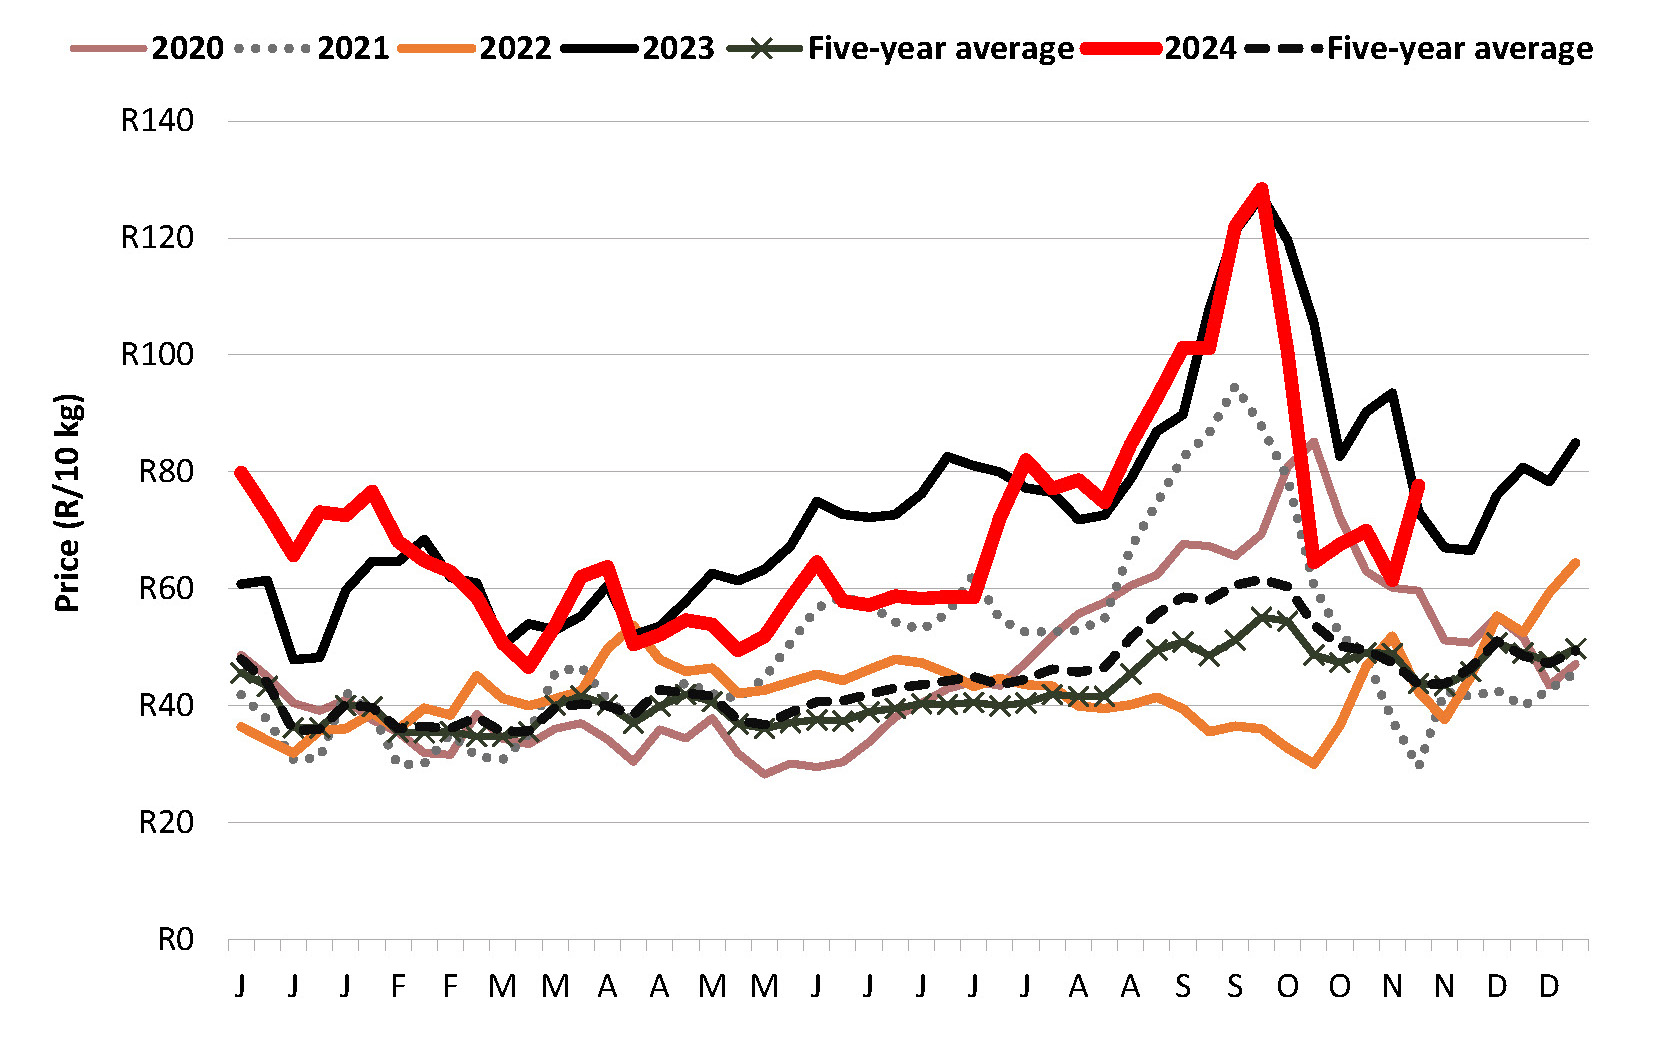
The average weekly price of potatoes in the first 44 weeks of 2024 reflected a notable upward trend, with week 44 prices increasing by 4% compared to week 43. Figure 1 indicates the weekly average price at all fresh produce markets (FPMs) for all classes and sizes.
The average weekly price in week 44 was R69.93 per 10 kg bag. This figure, while higher than the previous week, is R20.27 lower than the price recorded in the same week of 2023, underscoring significant year-on-year volatility in market dynamics.
Figure 1: Weekly average prices of all classes and sizes at all FPMs. (Source: RSA file)
Stock levels and sales
Figure 2 reflects the daily average stock levels and prices. It indicates the interplay between supply and demand. Regarding 10 kg bags, an average of 741 000 were in stock daily across South African FPMs during the first 44 weeks of 2024. A sharp dip in stock levels between mid-September and early October caused prices to spike, reflecting the typical sensitivity of potato prices to inventory fluctuations.
Figure 2: Daily average stock levels compared to the daily average price of all classes and sizes.
(Source: Johannesburg Market daily price and stock)
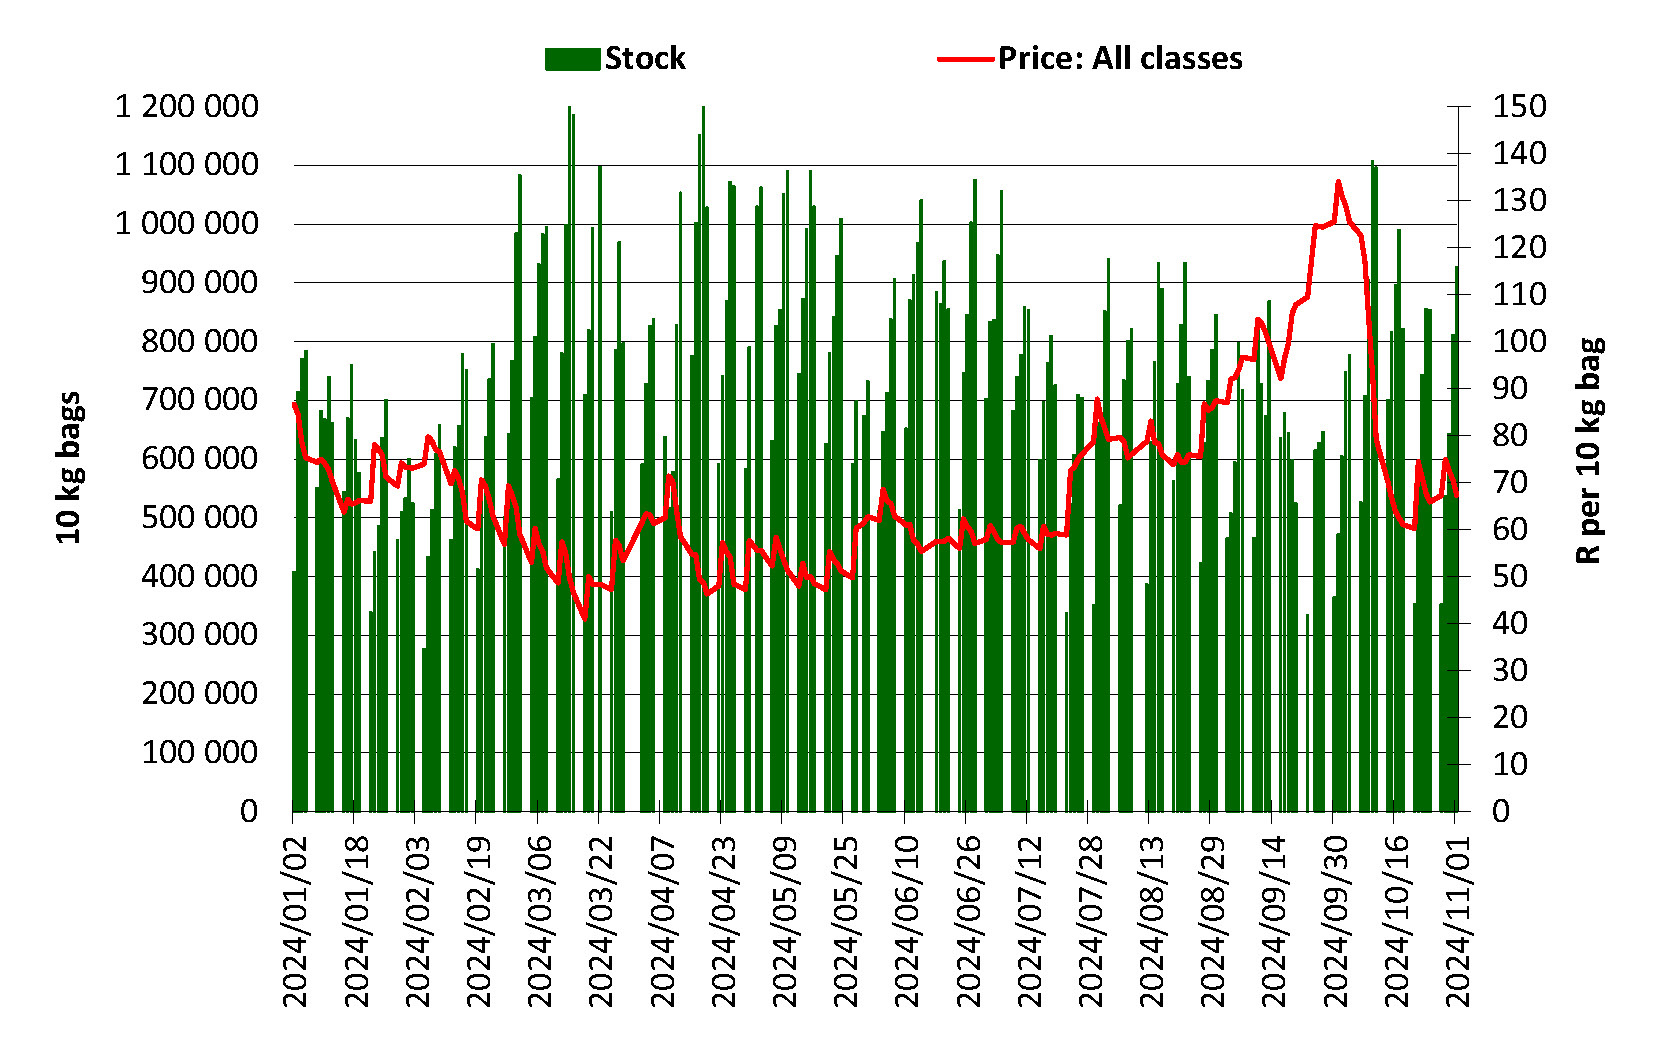
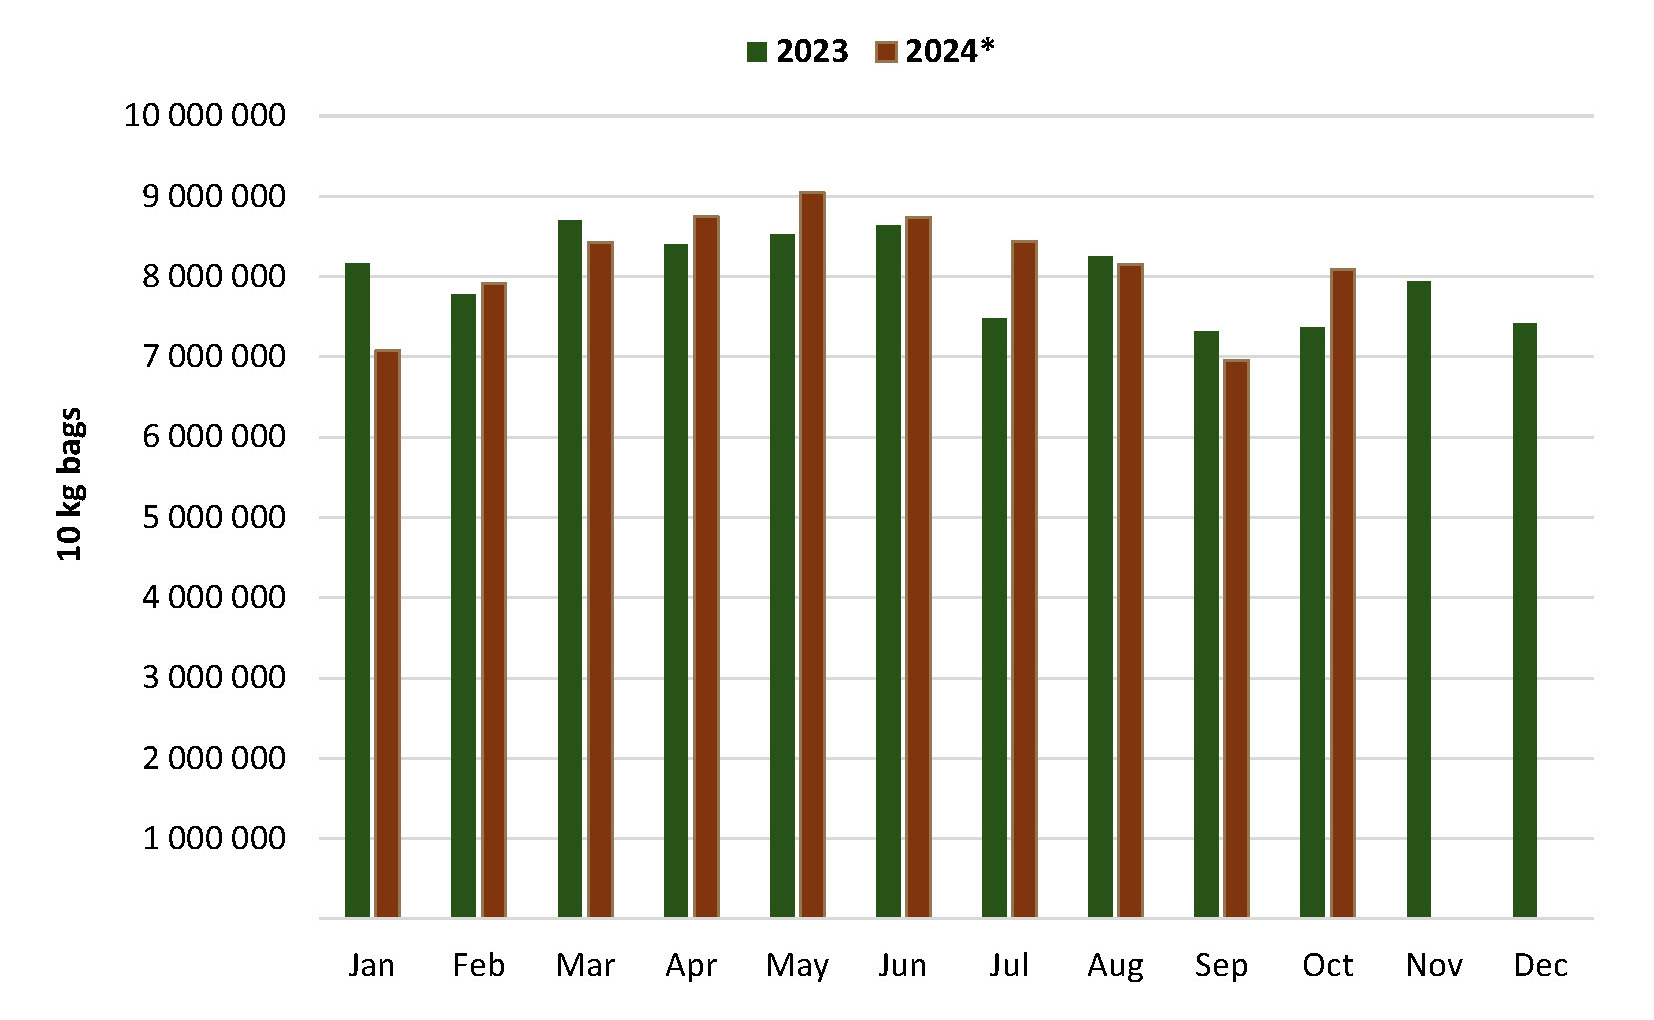
Figure 3 compares monthly sales levels year-on-year, highlighting contrasting September and October 2024 trends. September experienced a decline of 358 716 bags compared to the previous year, while October saw an increase of 720 748 bags. This sharp recovery resulted in 16% more bags sold in October than in September.
Figure 3: Average daily stock levels per month in 2023 versus 2024. (Source: RSA File)
Weekly and monthly sales
Despite some months outperforming 2023, overall sales in the first 44 weeks of 2024 were 7.29 million bags lower than the five-year average for the same period. Nonetheless, the total sales volume exceeded 82.9 million 10 kg bags, as shown in Figure 4.
Figure 4: Cumulative number of 10 kg bags sold at FPMs until week 44 of every year. (Source: RSA file)
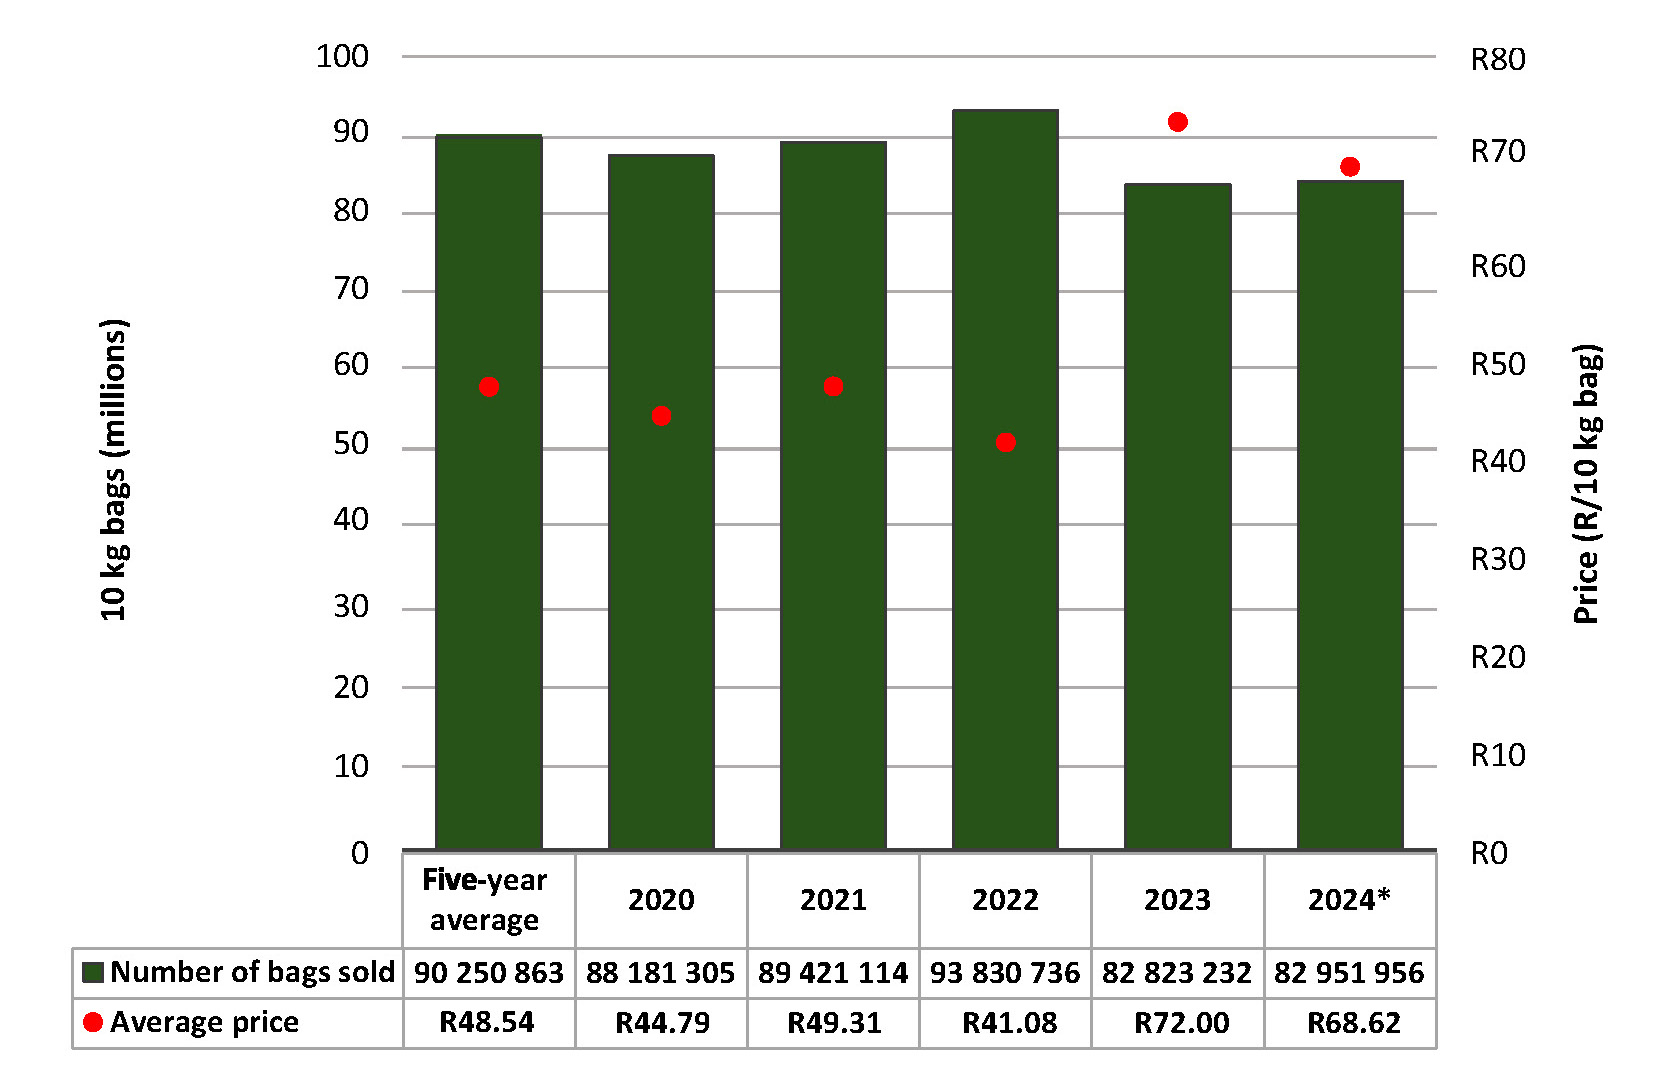
Average prices for 2024 were also noteworthy, sitting at R20.08 higher than the five-year average.
Monthly sales trends at FPMs, depicted in Figure 5, highlight the September slump to 6.96 million 10 kg bags from August’s 8.15 million bags. However, October rebounded with sales reaching 8.08 million bags, representing a 16% month-on-month increase and a 10% year-on-year growth compared to October 2023.
Figure 5: Monthly sales at FPMs from 2020 to 2024 (all packaging converted to 10 kg bags).
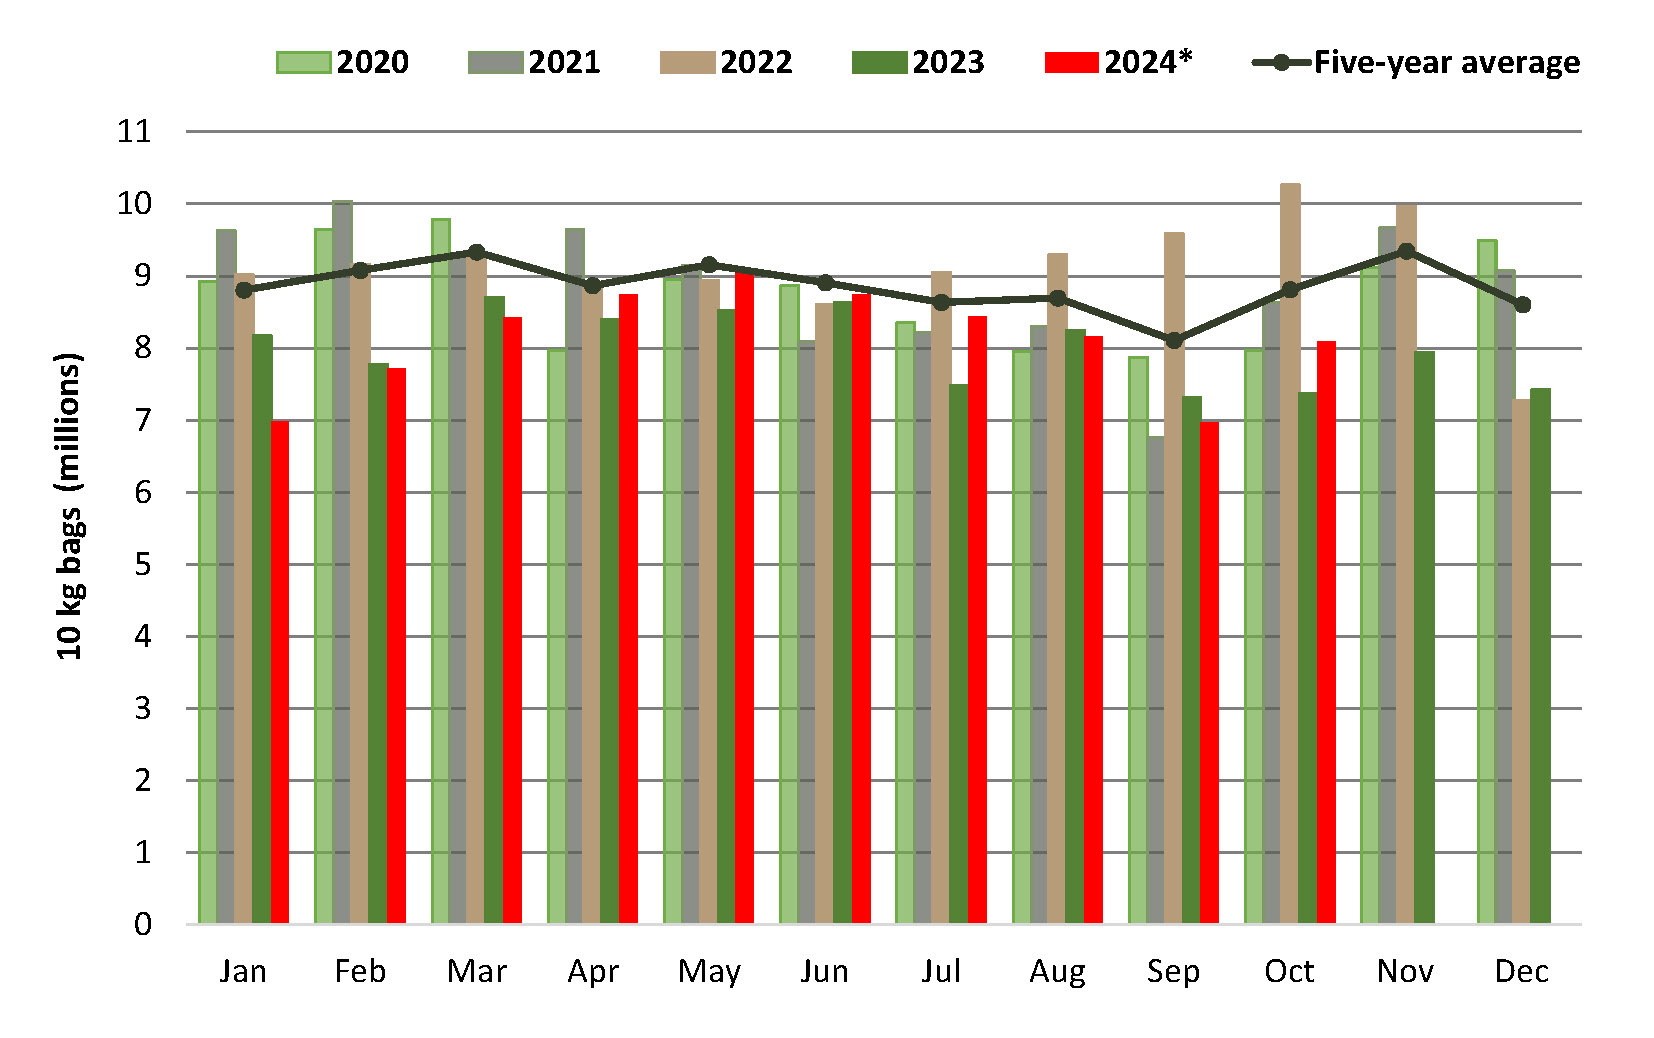
Table 1 contains the number of bags sold at the various FPMs during the first 44 weeks of 2024.
The five biggest markets during this period were collectively responsible for 83.8% of the country’s sales, showcasing their pivotal role in the potato supply chain. The average price (all classes and sizes) for each market also appears in Table 1.
In terms of the top average price per 10 kg bag received on the markets during the first 44 weeks, Nelspruit Market led with R82.57 per 10 kg bag followed by Cape Town Market with R75.11 per 10 kg bag, and East London Market with R72.76 per 10 kg bag. In terms of Class 1 (all sizes) sales, Johannesburg, Durban, and Nelspruit markets’ total sales consisted of 77.75 and 74% bags, respectively – with Johannesburg being the highest of the top five markets.
Table 1: Sales at FPMs up until week 44 of 2024.
| Percentage of sales at FPMs | |||||||
|---|---|---|---|---|---|---|---|
| Market | Number of bags (10 kg) | % of total | Avg price (R/10 kg) | Class 1 | Class 2 | Class 3 and 4 | Class 1 M |
| Johannesburg | 33 828 843 | 41.8% | 68.27 | 77% | 15% | 8% | 18% |
| Tshwane | 15 426 382 | 19.1% | 67.61 | 66% | 23% | 11% | 16% |
| Durban | 7 461 642 | 9.2% | 68.9 | 75% | 16% | 9% | 25% |
| Cape Town | 6 683 794 | 8.3% | 75.11 | 71% | 25% | 4% | 21% |
| Springs | 4 357 432 | 5.4% | 64.86 | 63% | 22% | 15% | 14% |
| Bloemfontein | 2 111 358 | 2.6% | 69.79 | 59% | 28% | 13% | 16% |
| East London | 2 229 006 | 2.8% | 72.76 | 69% | 21% | 9% | 21% |
| Klerksdorp | 2 093 867 | 2.6% | 65.95 | 66% | 23% | 11% | 16% |
| Welkom | 1 923 515 | 2.4% | 65.32 | 55% | 27% | 18% | 12% |
| Port Elizabeth | 1 769 446 | 2.2% | 68.09 | 68% | 21% | 10% | 24% |
| Pietermaritzburg | 1 750 225 | 2.2% | 64.42 | 62% | 23% | 15% | 15% |
| Vereeniging | 456 153 | 0.6% | 66.28 | 69% | 23% | 8% | 15% |
| Witbank | 456 701 | 0.6% | 70.13 | 70% | 20% | 11% | 14% |
| Kimberley | – | 0% | – | 0% | 0% | 0% | 0% |
| Nelspruit | 330 862 | 0.4% | 82.57 | 74% | 20% | 6% | 9% |
| George | – | 0% | – | 0% | 0% | 0% | 0% |
| Kei (Umtata) | 13 102 | 0% | – | 26% | 42% | 32% | 17% |
| Total | 80 892 328 | 100% | – | 71% | 19% | 9% | 18% |
Price changes
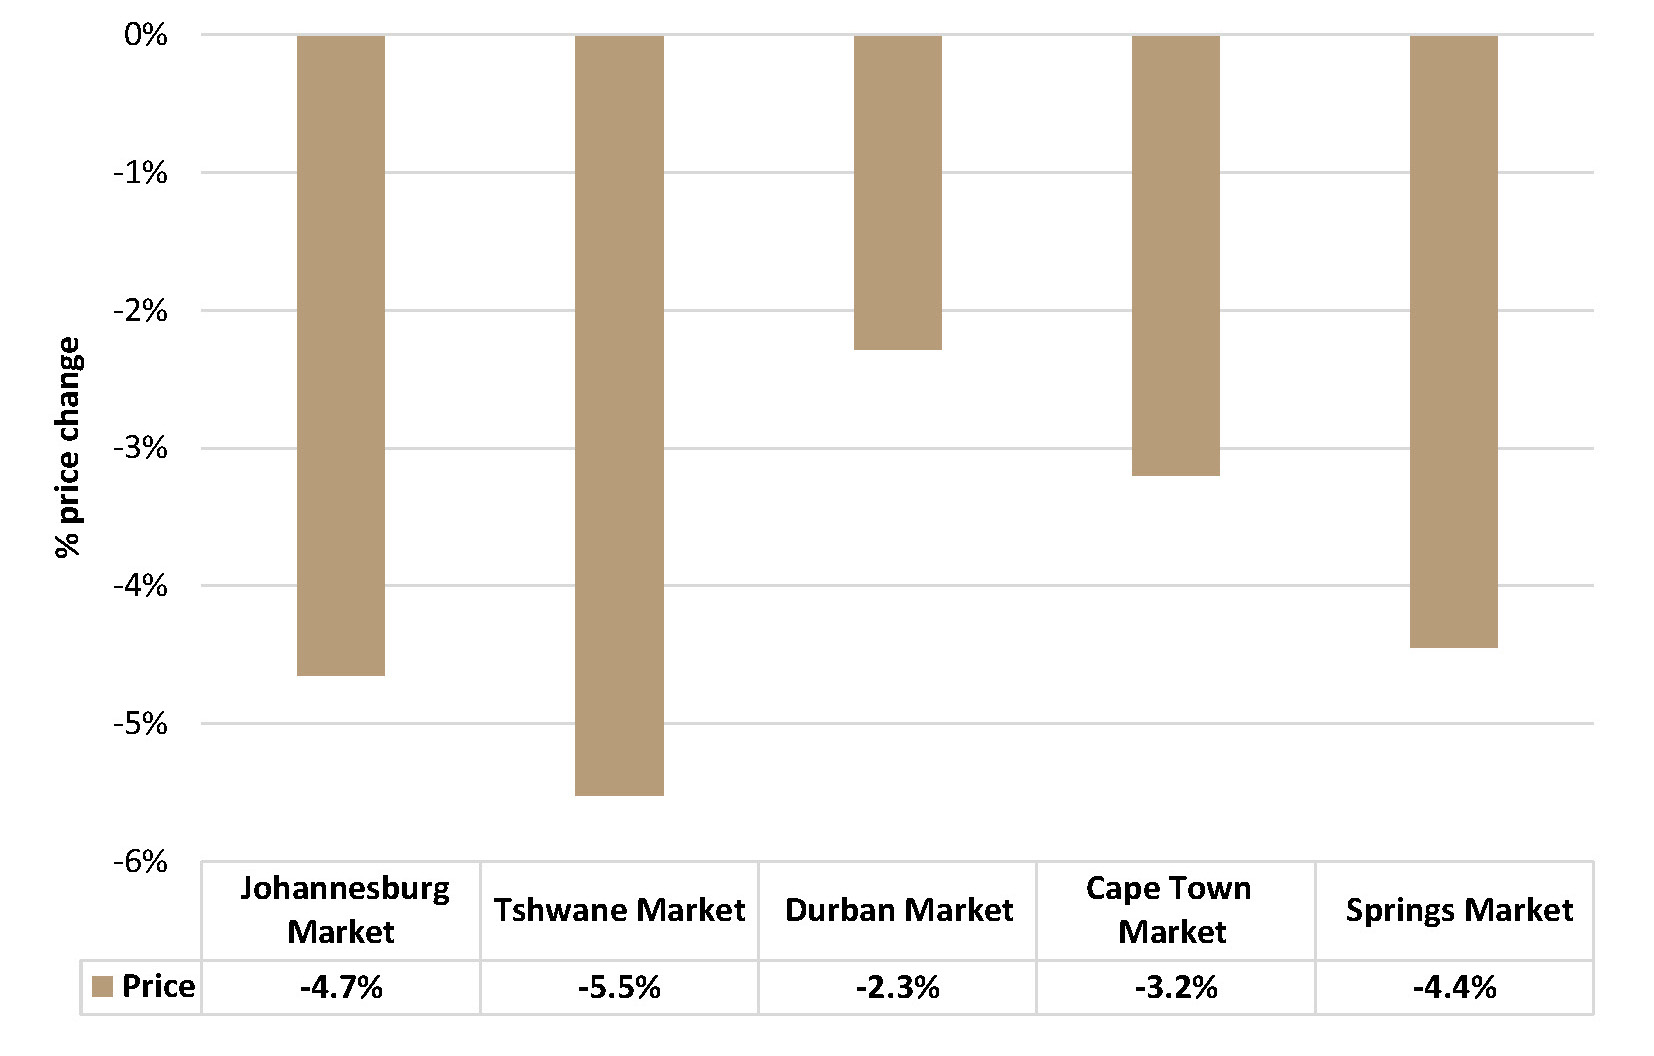
Figure 6 reflects the year-on-year price change at the top five markets for the first 44 weeks of 2024, with prices at all five markets reflecting a decrease. Tshwane Market’s price showed the greatest percentage decline with a price decrease of 5.5%.
Figure 6: Year-on-year price change at the top five markets from 2020 to 2024.
The volumes sold at this market increased by 4.2% year-on-year, as shown in Figure 7.
Figure 7: Top five markets’ year-on-year changes in bag sales.
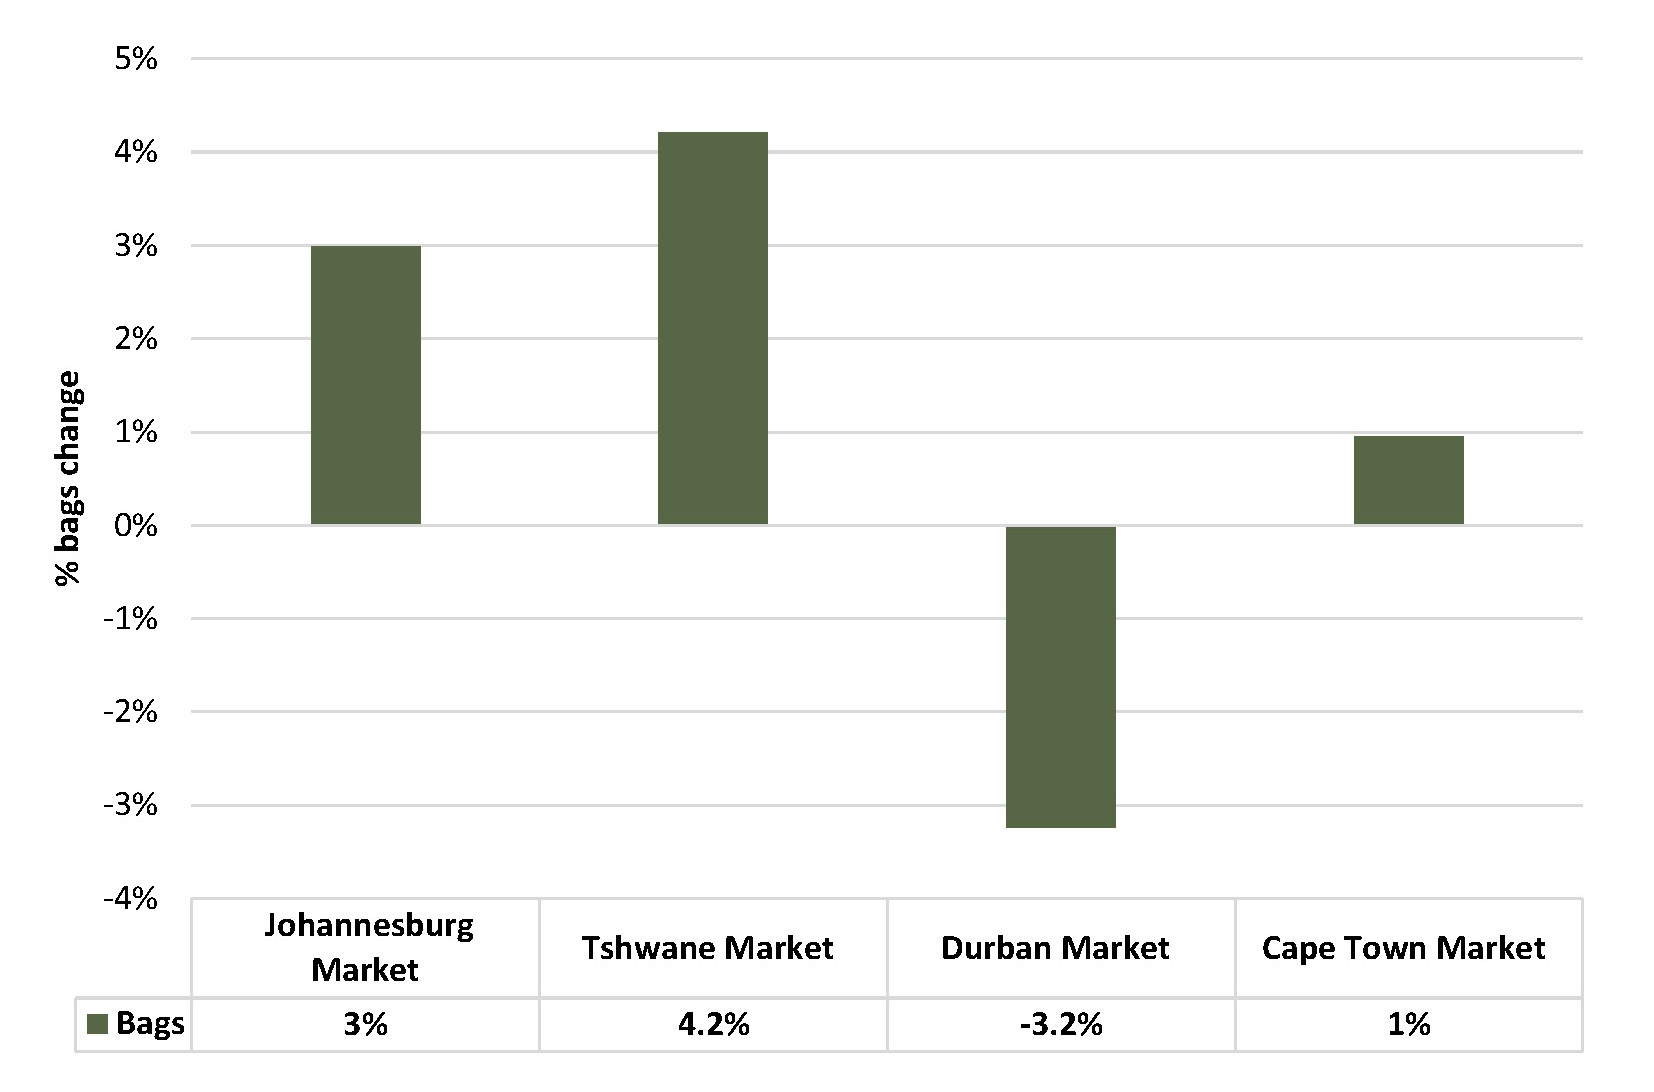
The volumes sold at Johannesburg Market increased by 3% year-on-year.
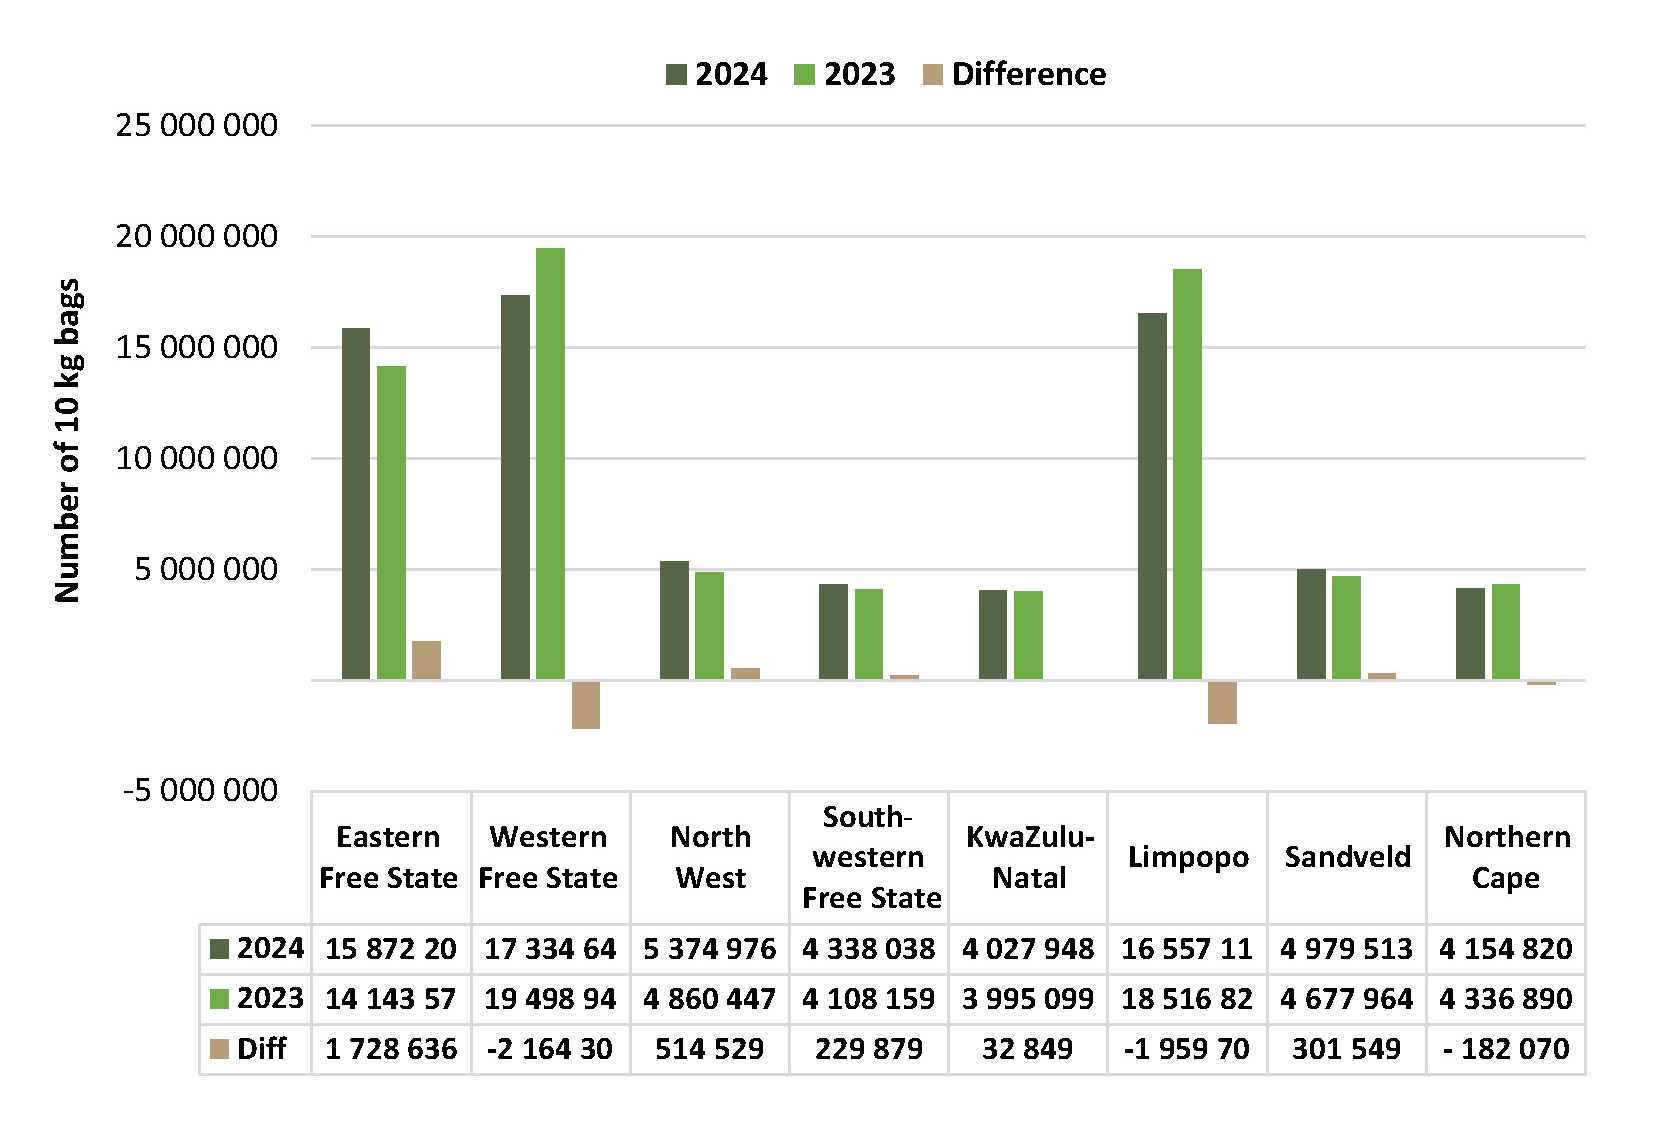
Sales performance at regional levels, detailed in Figure 8, reveals mixed results. The Western Free State, Limpopo, and Northern Cape recorded declining sales volumes, while all other regions experienced growth compared to 2023. The top three regions, Limpopo, Gauteng, and Mpumalanga, accounted for a substantial 62% of total potato sales in the first 44 weeks of 2024 (Table 2).
Figure 8: Number of 10 kg bags sold during the first 44 weeks of 2023 compared to 2024.
The classification of potatoes also varies significantly by region, as shown in Table 2. Regions such as Limpopo and Gauteng led in Class 1 sales, with 86 and 84% of their sales falling into this premium category, respectively.
| Percentage of sales at FPMs | |||||||
|---|---|---|---|---|---|---|---|
| Region | Number of bags (10 kg) | % of total | Avg price (R/10 kg) | Class 1 | Class 2 | Class 3 and 4 | Class 1 M |
| Eastern Free State | 15 872 209 | 20% | 56.55 | 61% | 23% | 16% | 13% |
| Western Free State | 17 334 464 | 21% | 66.53 | 68% | 22% | 10% | 20% |
| North West | 5 374 976 | 7% | 66.8 | 79% | 14% | 7% | 16% |
| Southwest Free State | 4 338 038 | 5% | 69.15 | 76% | 14% | 10% | 21% |
| KwaZulu-Natal | 4 027 948 | 5% | 64.78 | 74% | 20% | 6% | 12% |
| Limpopo | 16 557 112 | 20% | 85.55 | 86% | 10% | 3% | 22% |
| Sandveld | 4 979 513 | 6% | 76.52 | 72% | 26% | 2% | 22% |
| Northern Cape | 4 154 820 | 5% | 64.92 | 55% | 21% | 24% | 14% |
| Gauteng | 2 674 167 | 3% | 60.98 | 84% | 12% | 4% | 24% |
| Northeastern Cape | 1 547 017 | 2% | 56.78 | 57% | 33% | 11% | 19% |
| Other regions | 2 239 946 | 3% | 58.31 | 50% | 38% | 12% | 14% |
| Ceres | 659 430 | 1% | 71.63 | 71% | 16% | 13% | 25% |
| Mpumalanga | 615 287 | 1% | 66.95 | 80% | 16% | 4% | 18% |
| Eastern Cape | 516 821 | 1% | 77.7 | 66% | 24% | 10% | 23% |
| Southern Cape | 397 | 0% | 56.85 | 76% | 24% | 0% | 0% |
| Southwestern Cape | 1 | 0% | 120 | 0% | 0% | 100% | 0% |
| Total | 80 892 328 | 100% | – | 71% | 19% | 9% | 18% |
Overall, 13 of the 16 regions maintained a Class 1 sales ratio above 60%, reflecting consistent quality standards across much of the country.
For more information, email Dikgetho Mokoena at dikgetho@potatoes.co.za or Jodie Hattingh at jodie@potatoes.co.za.